Gallery

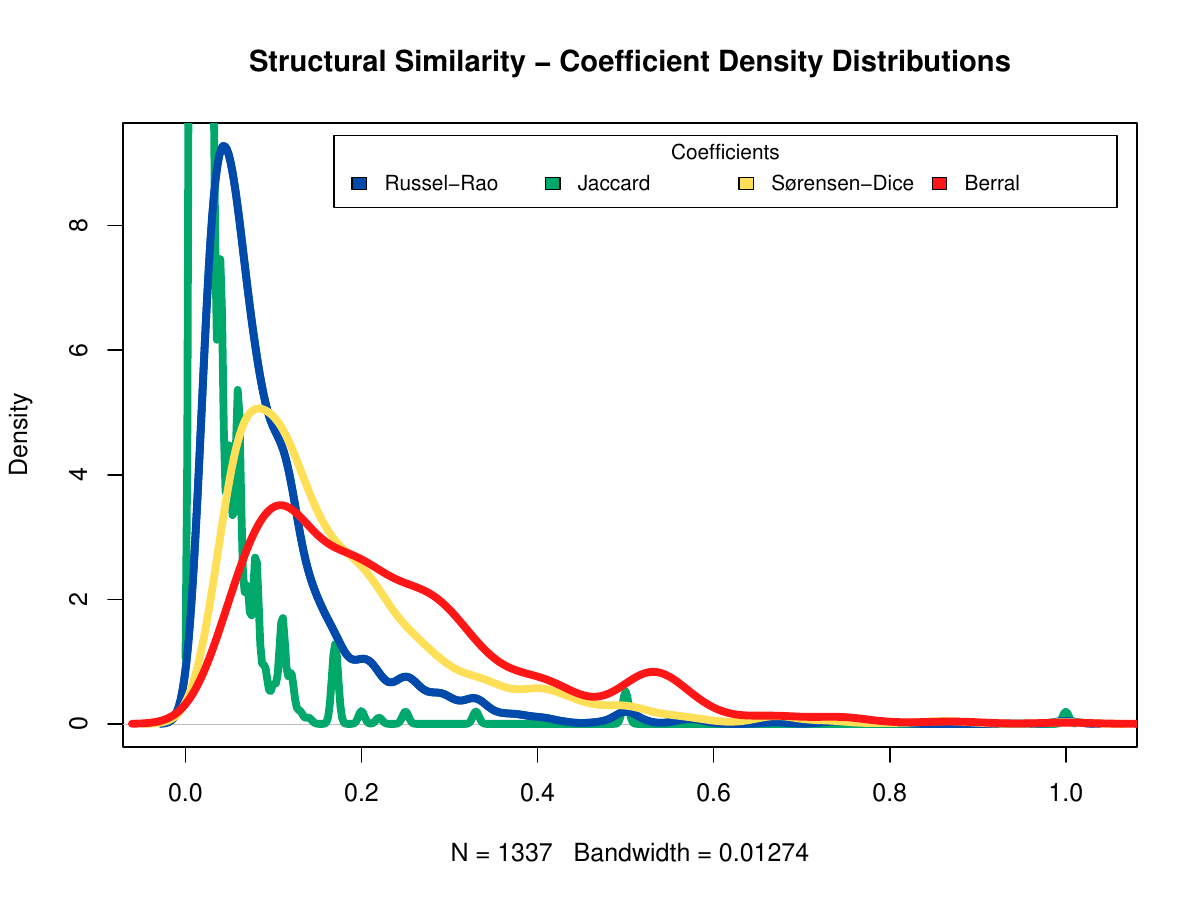
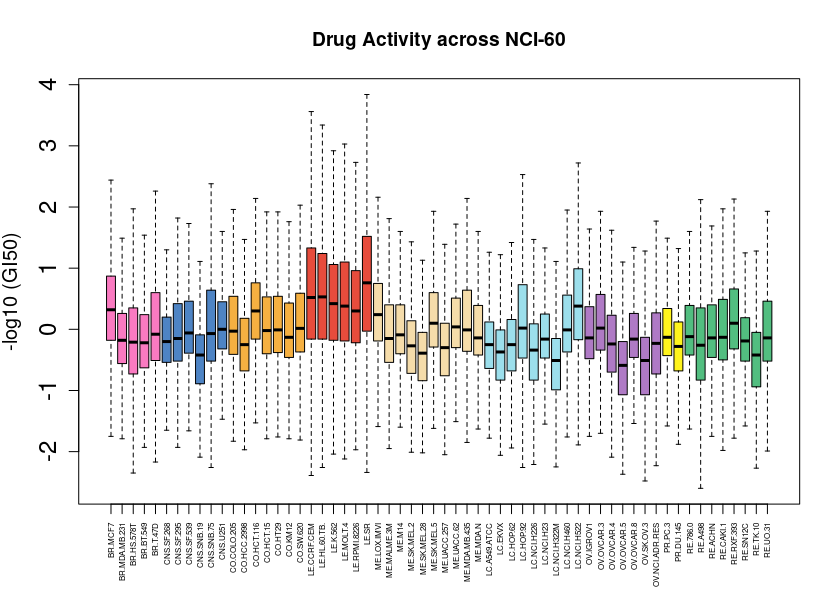
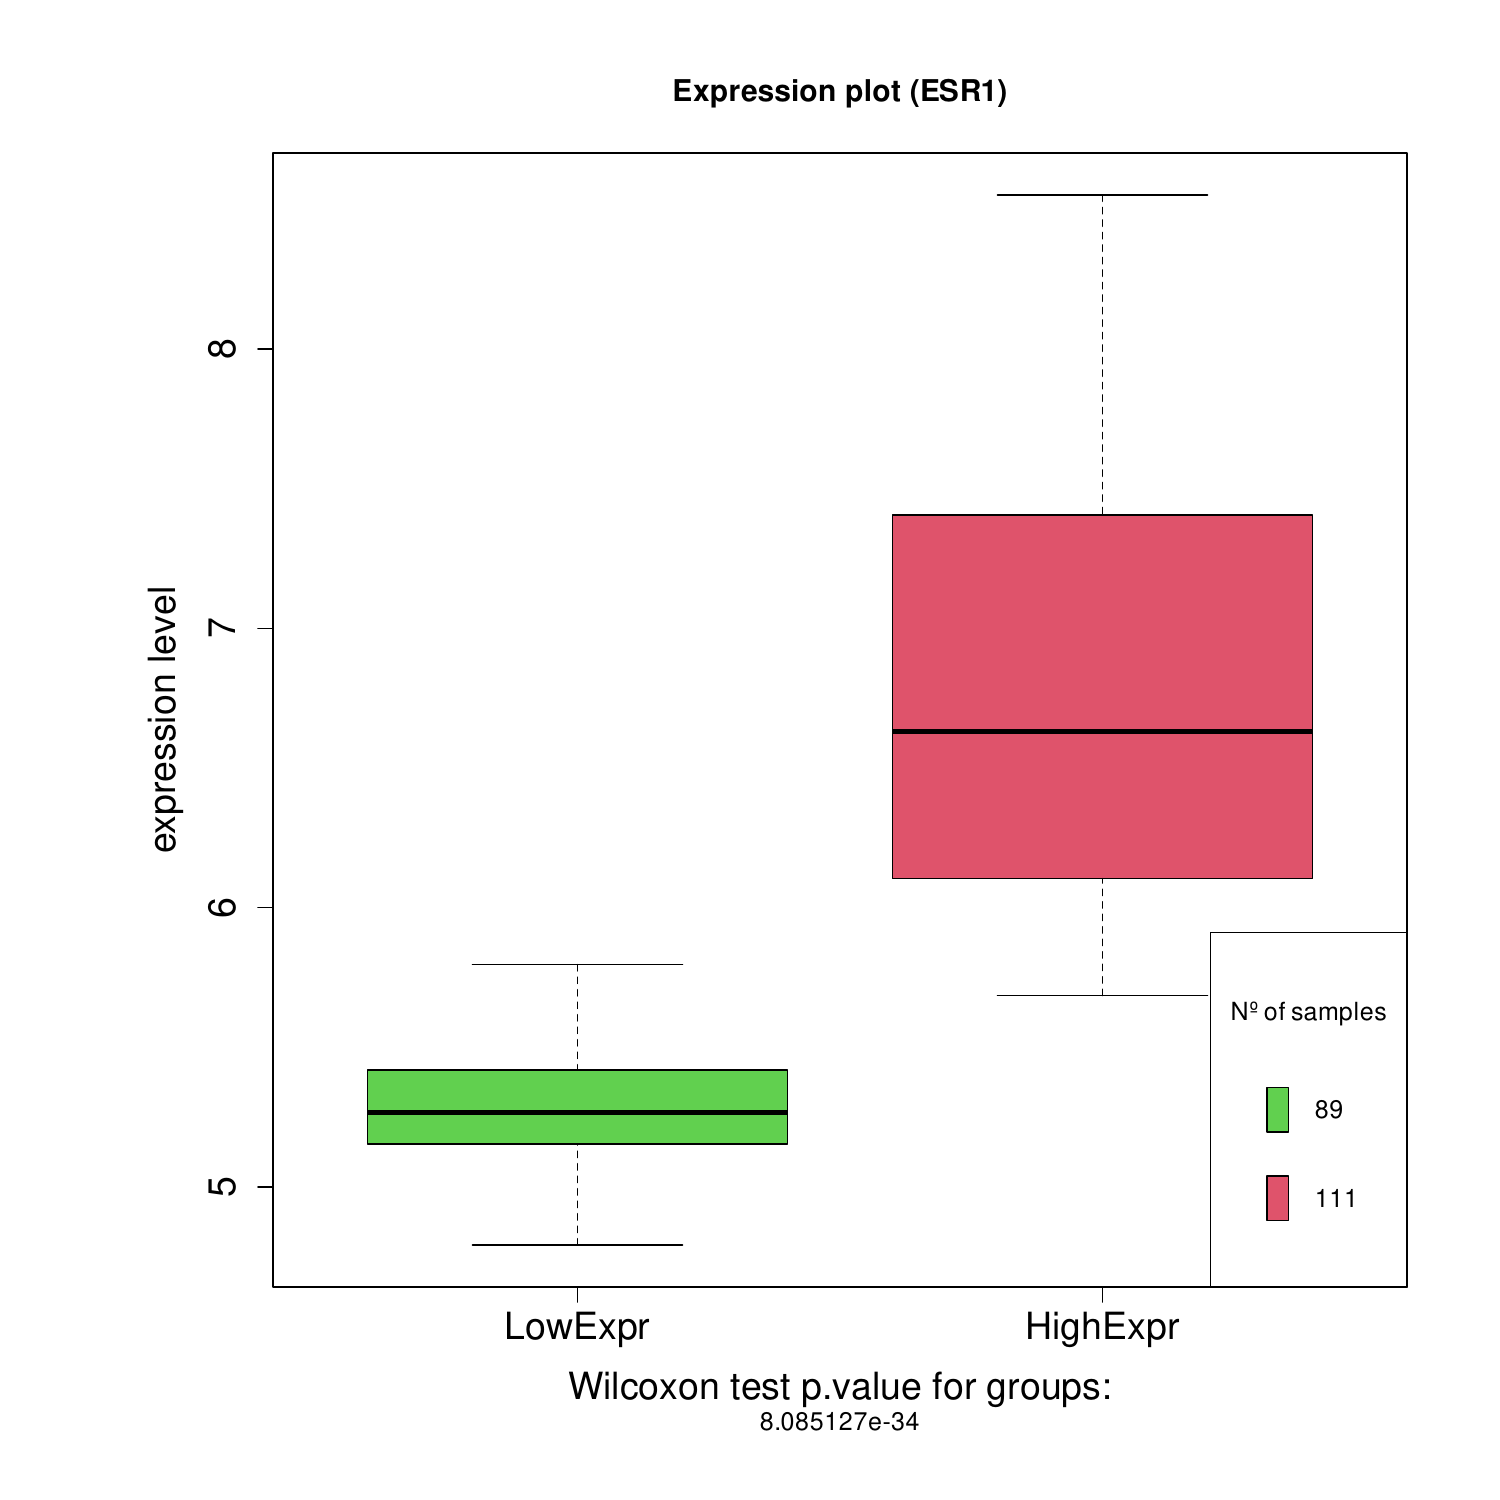
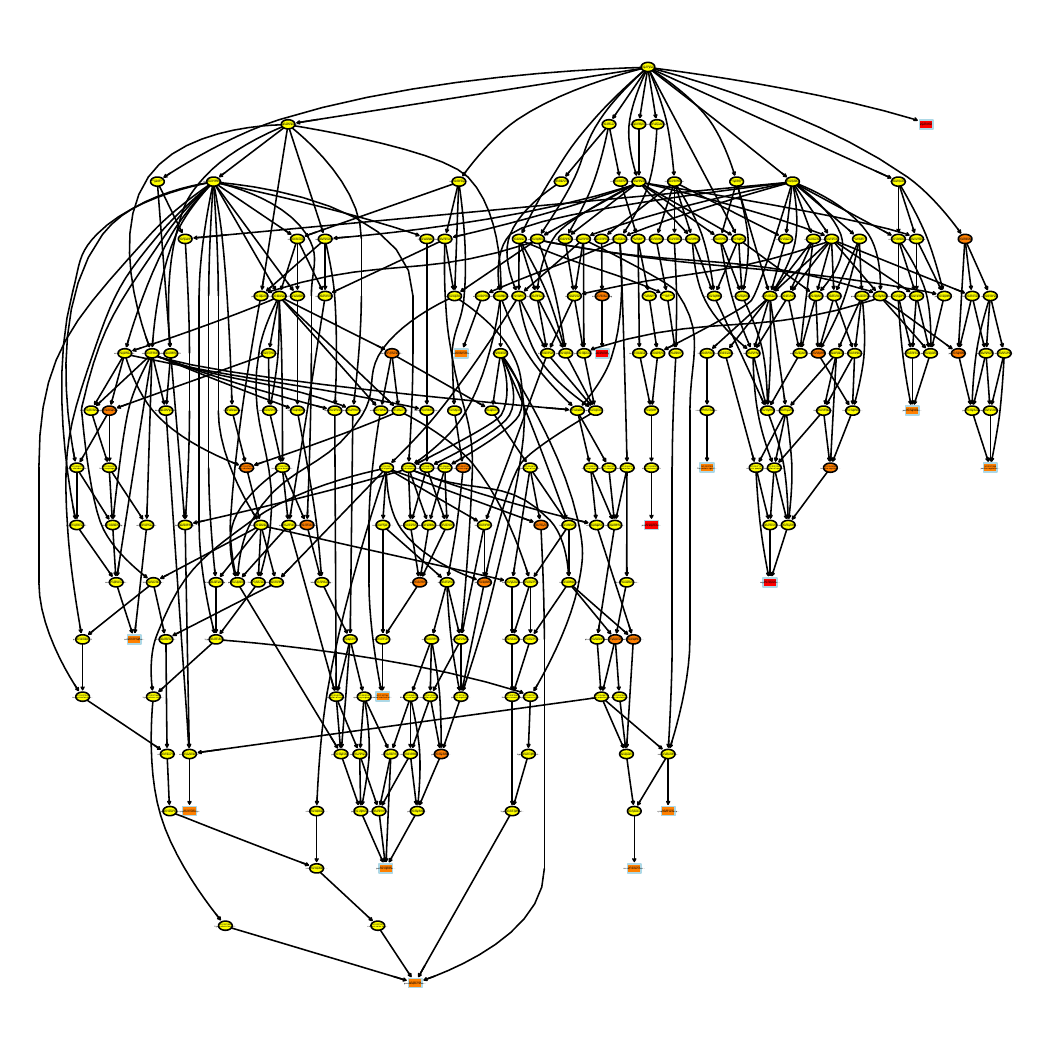
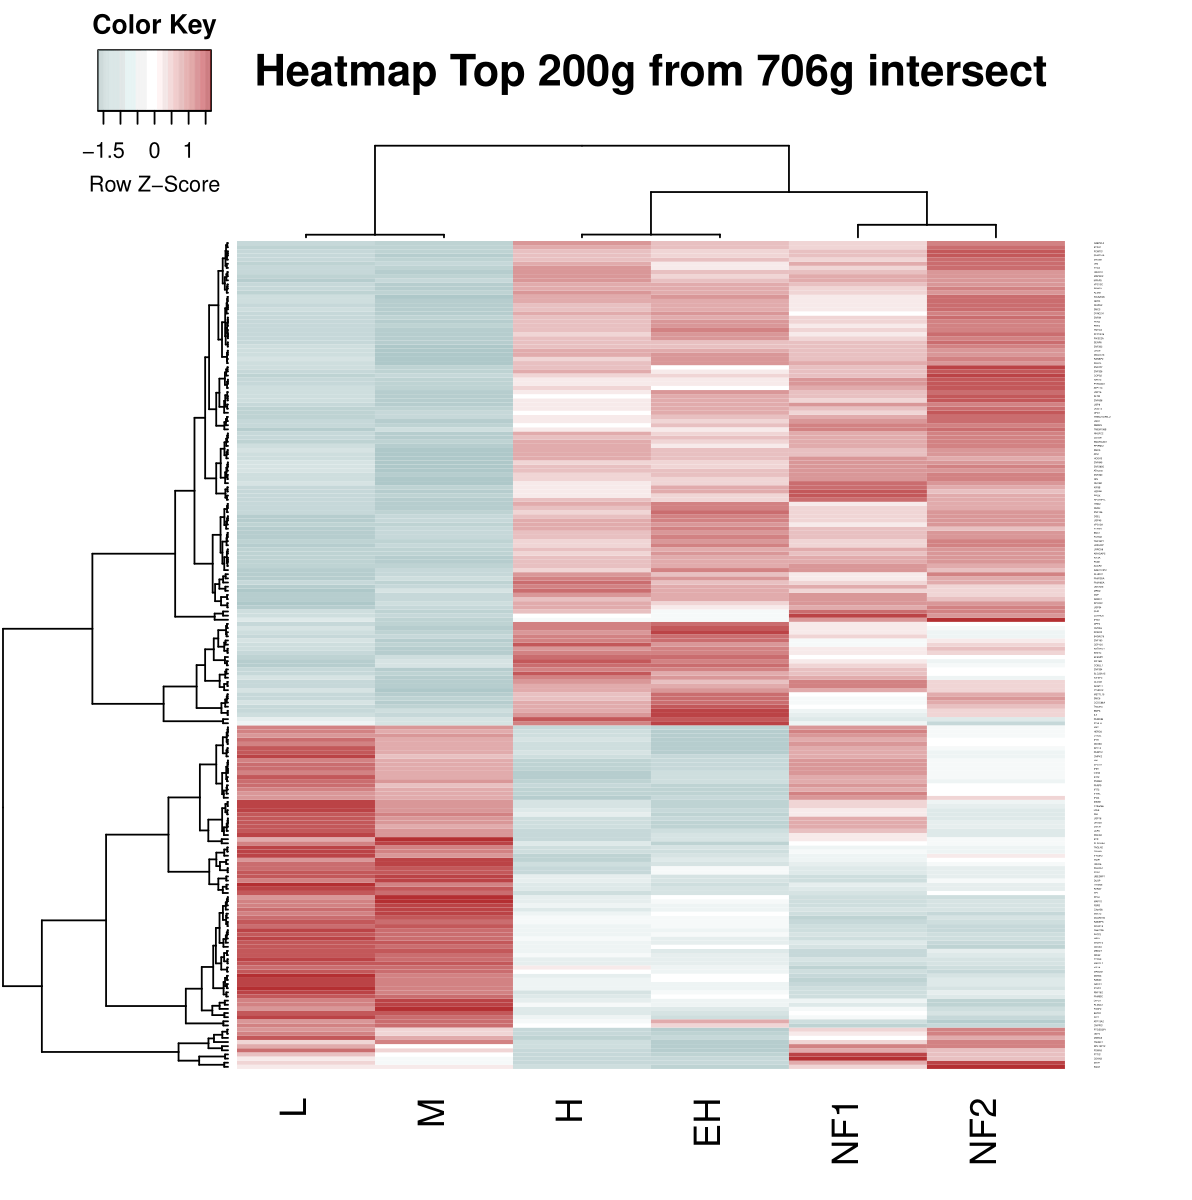
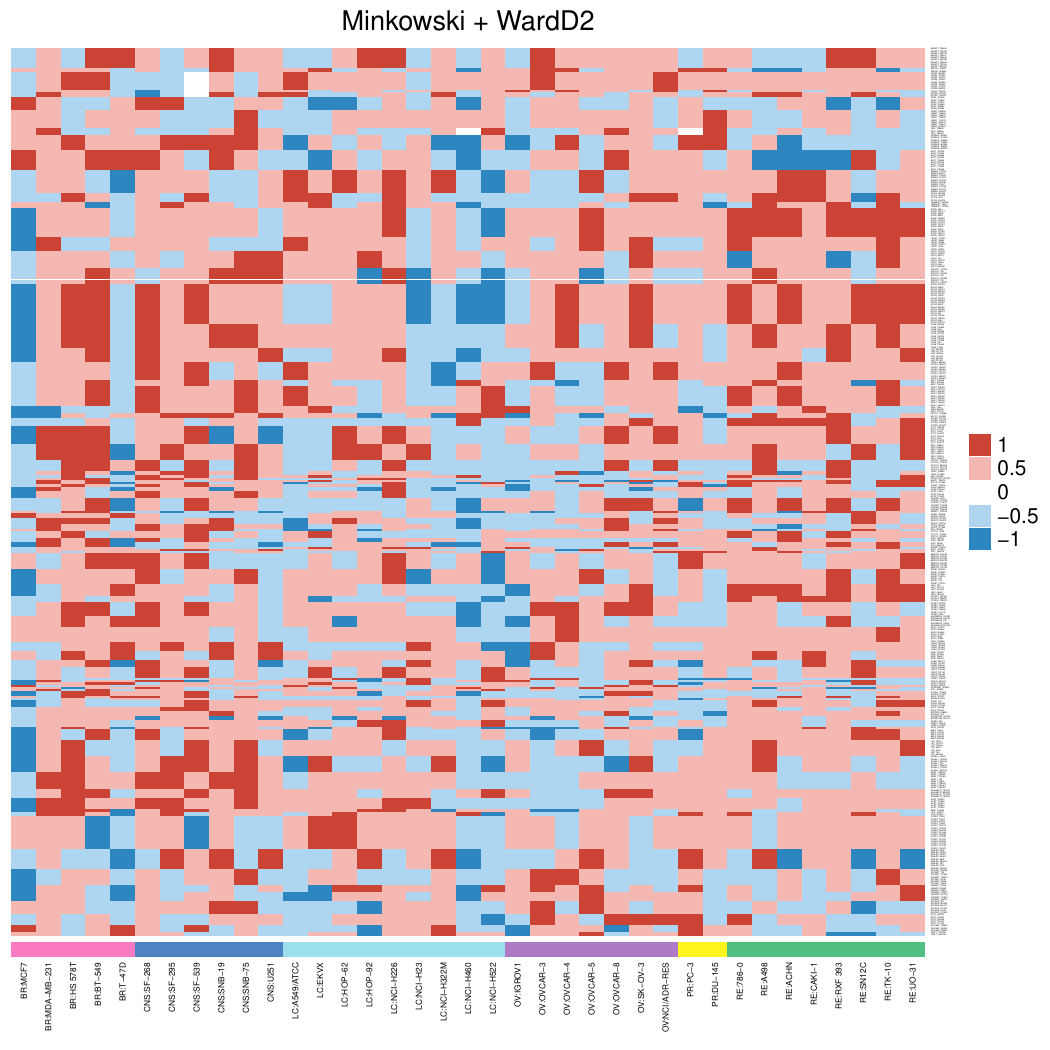
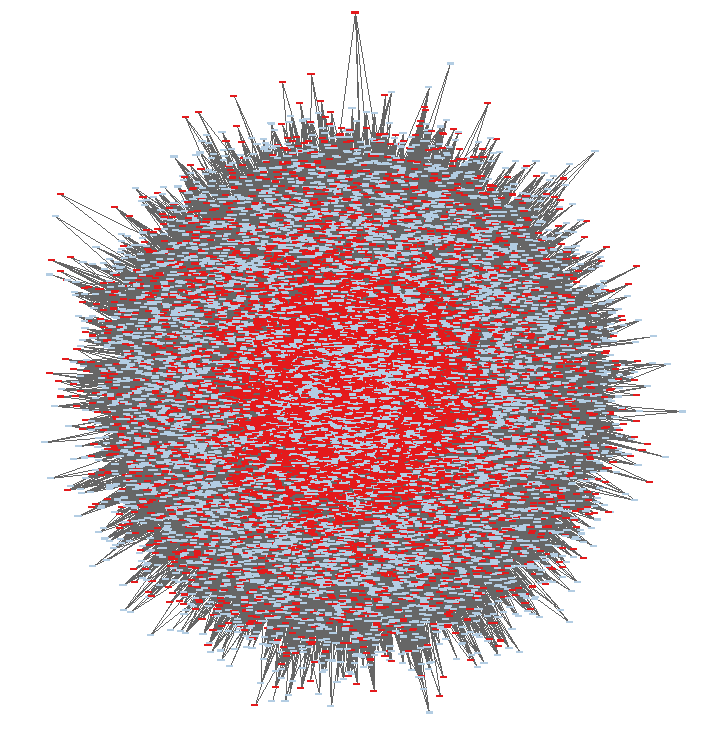
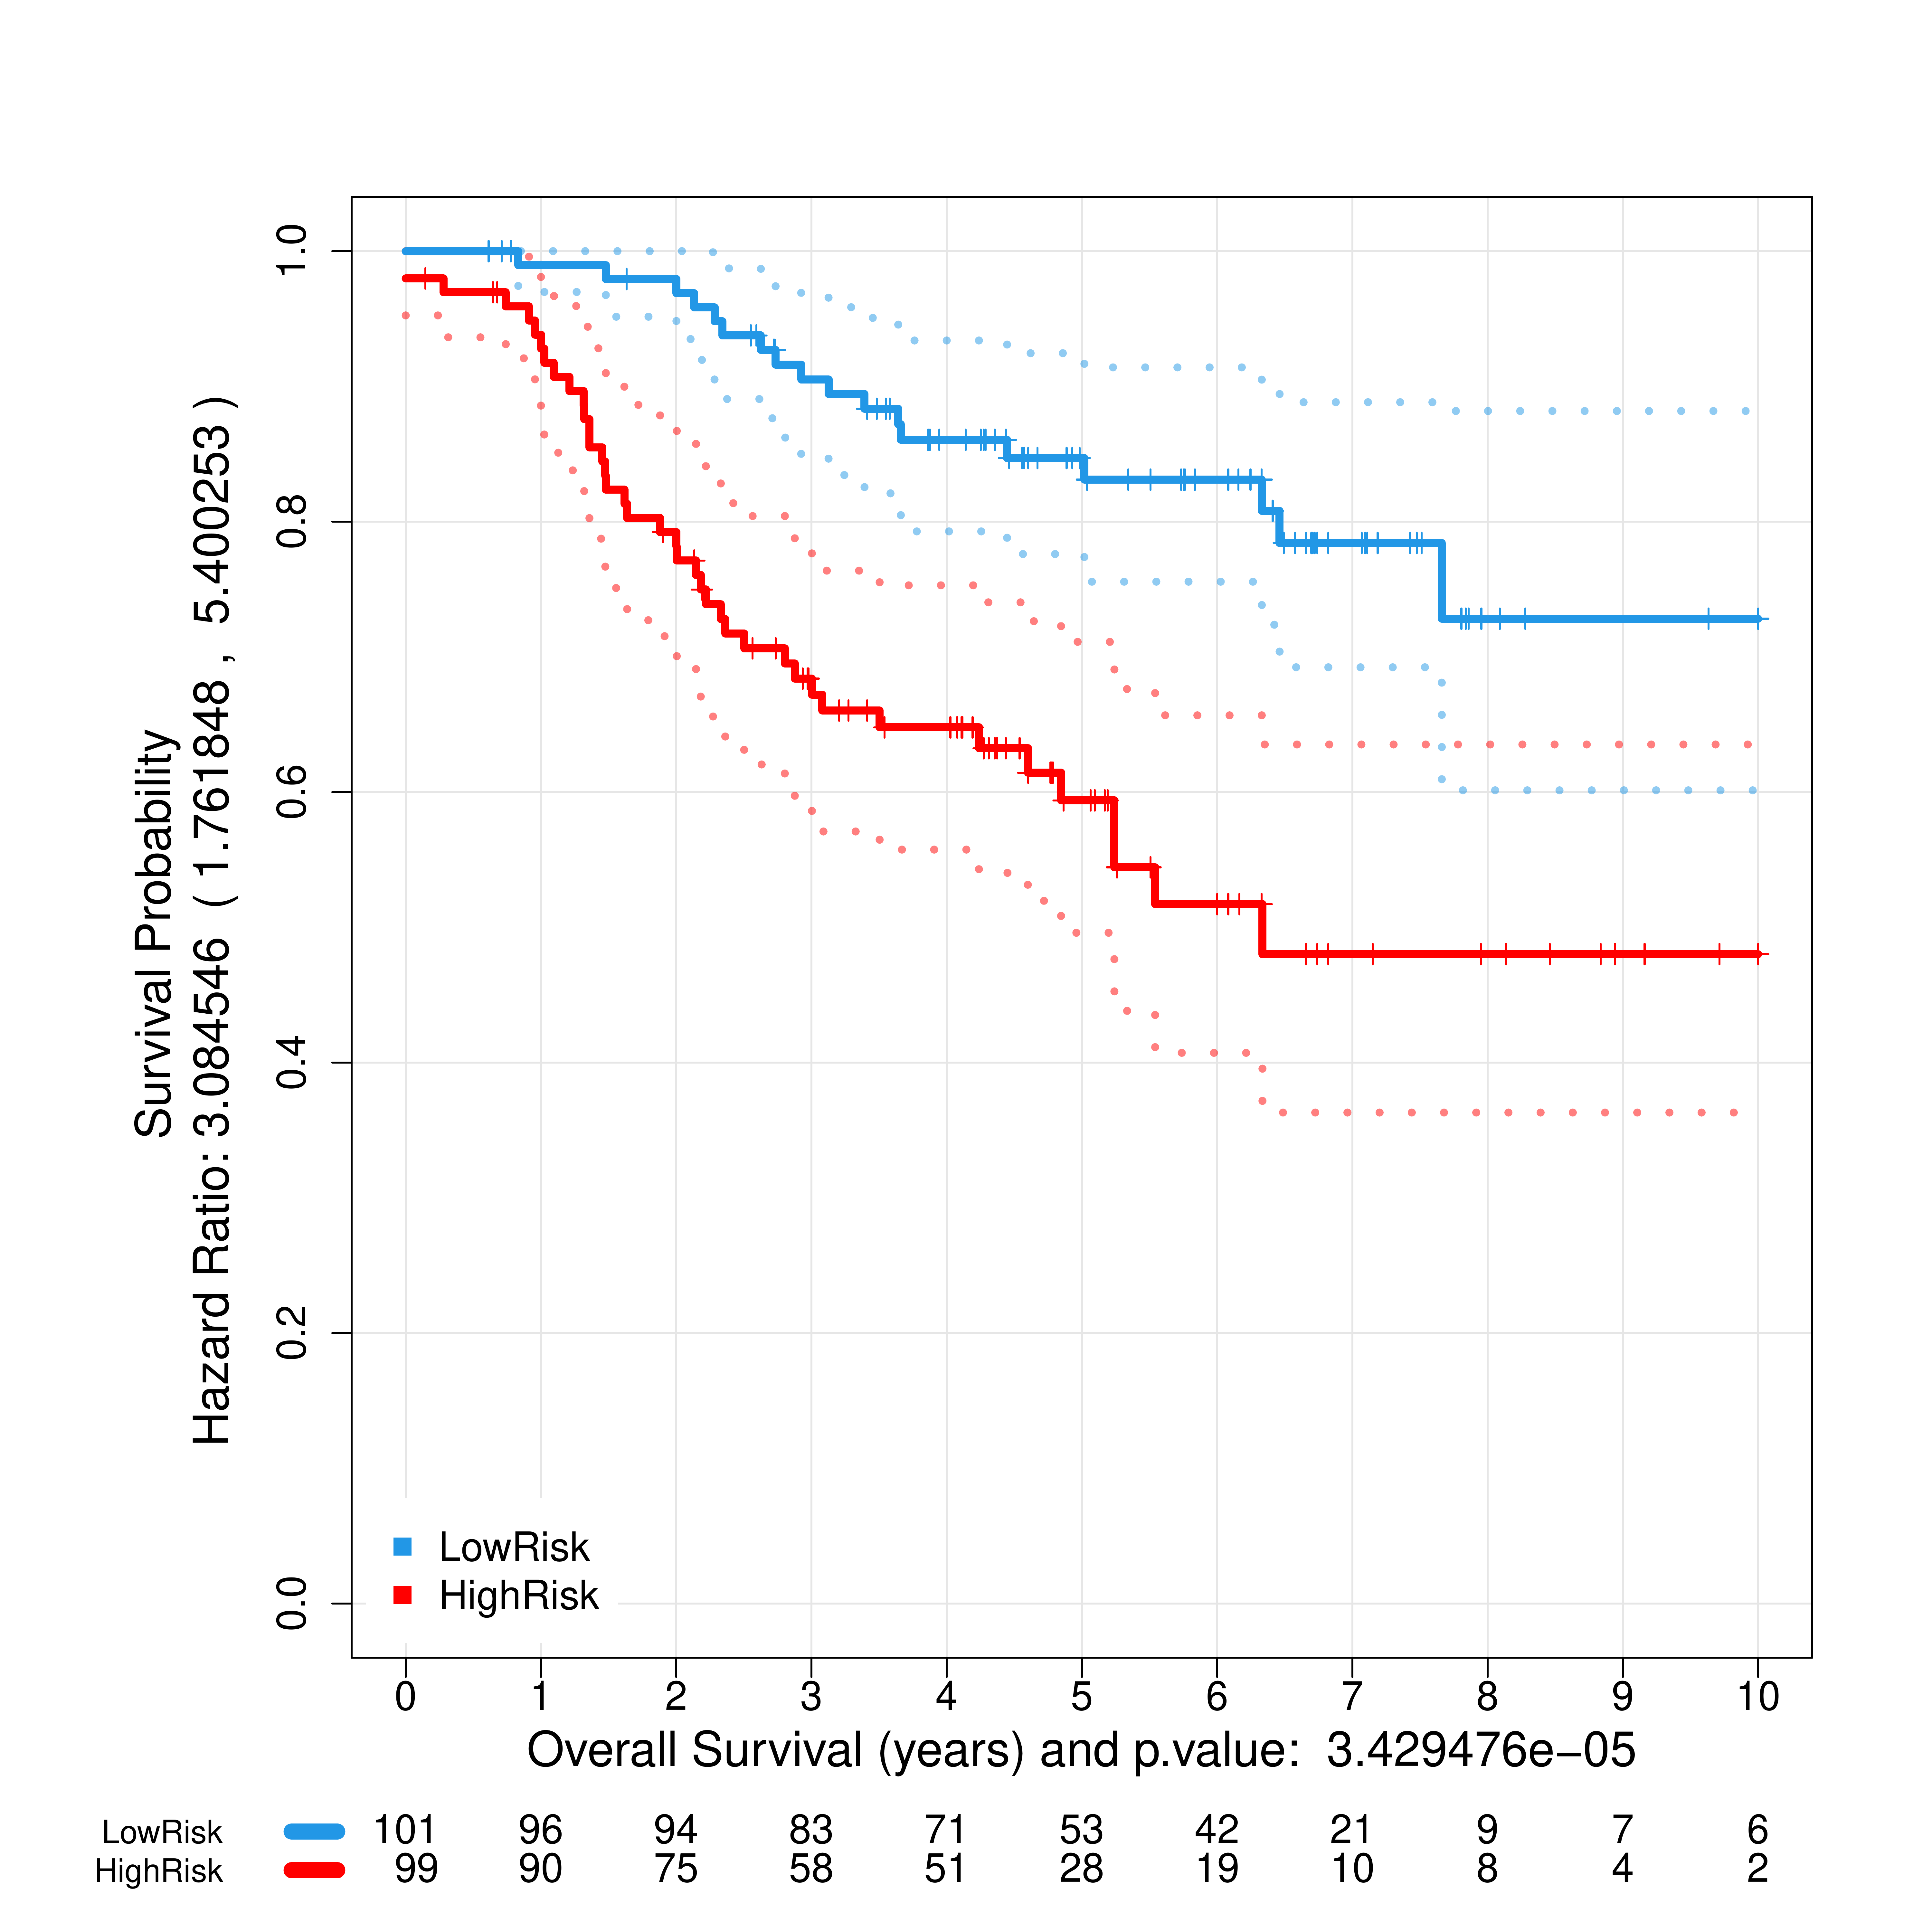
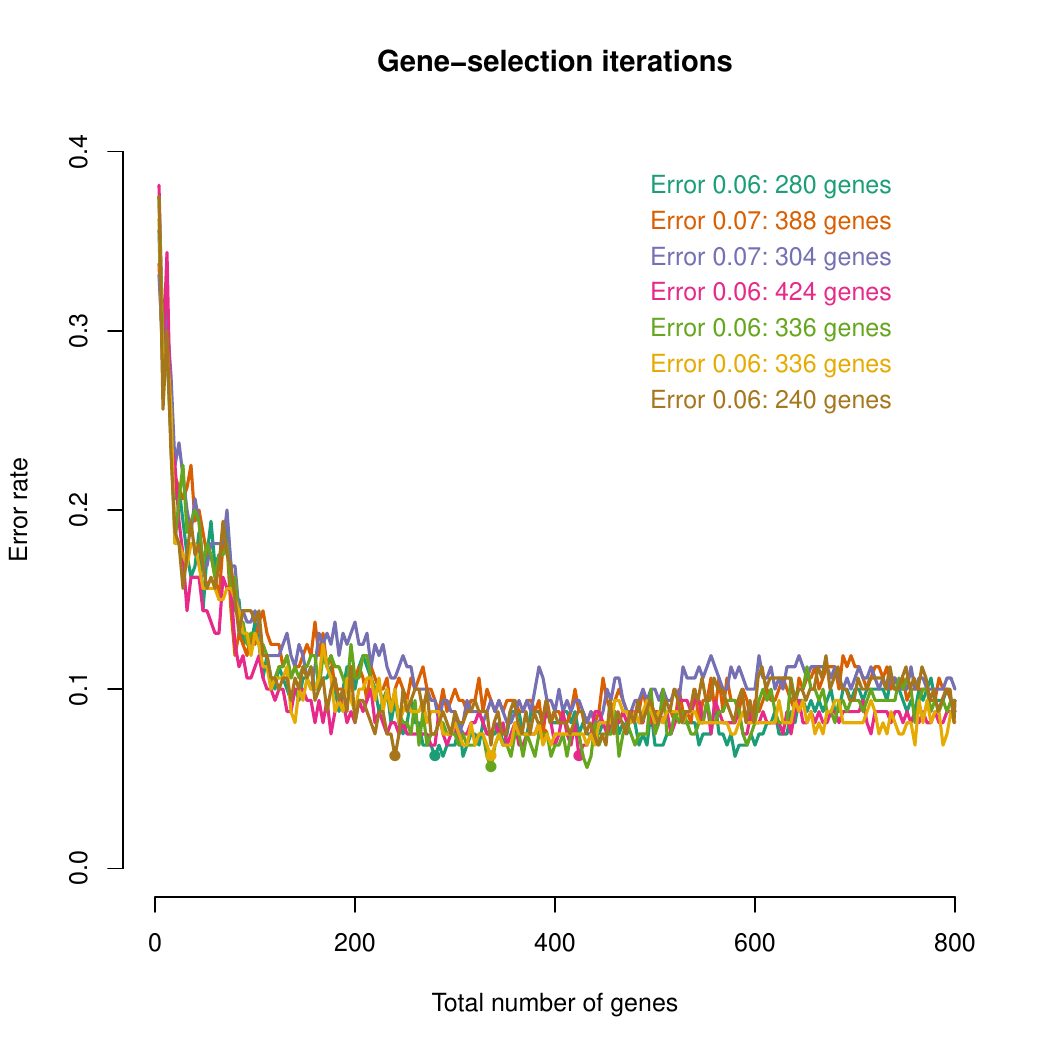
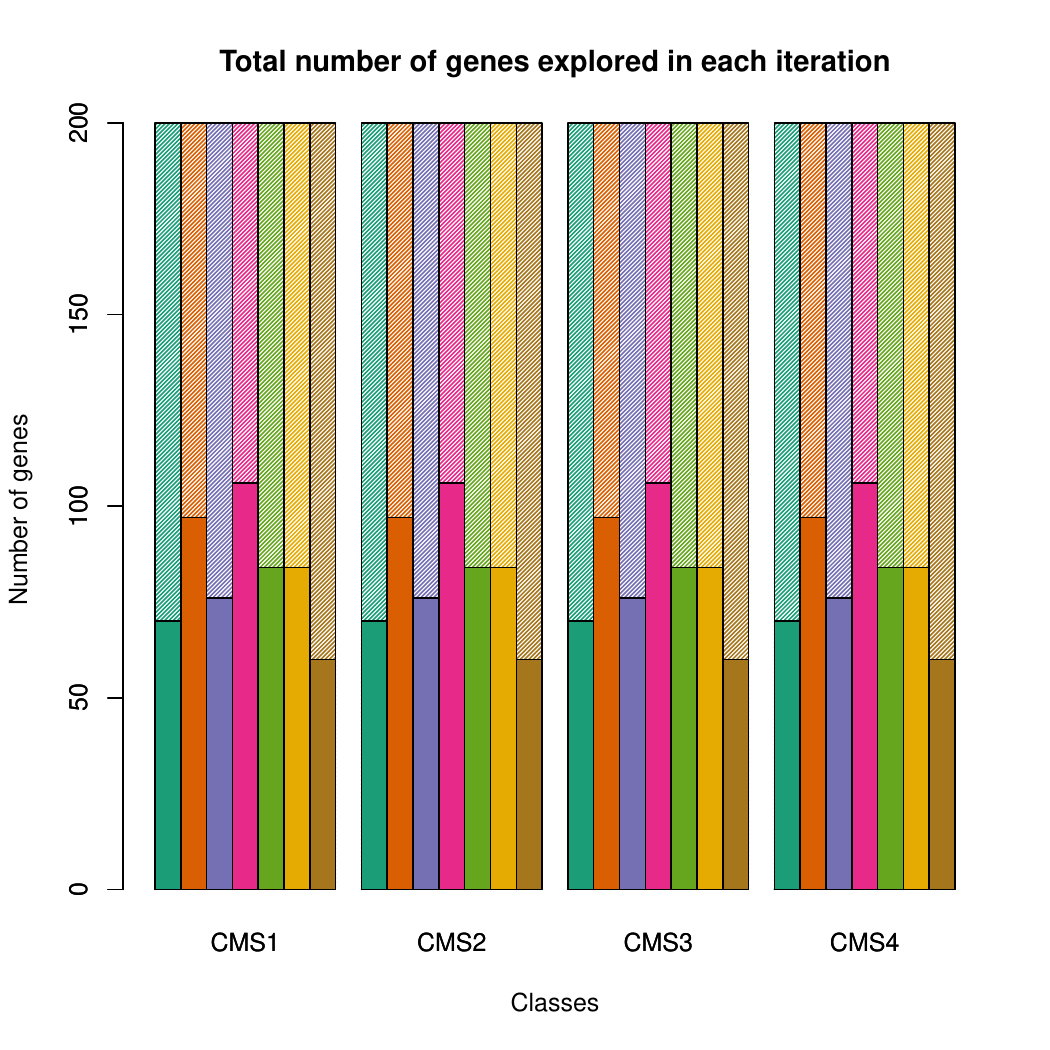
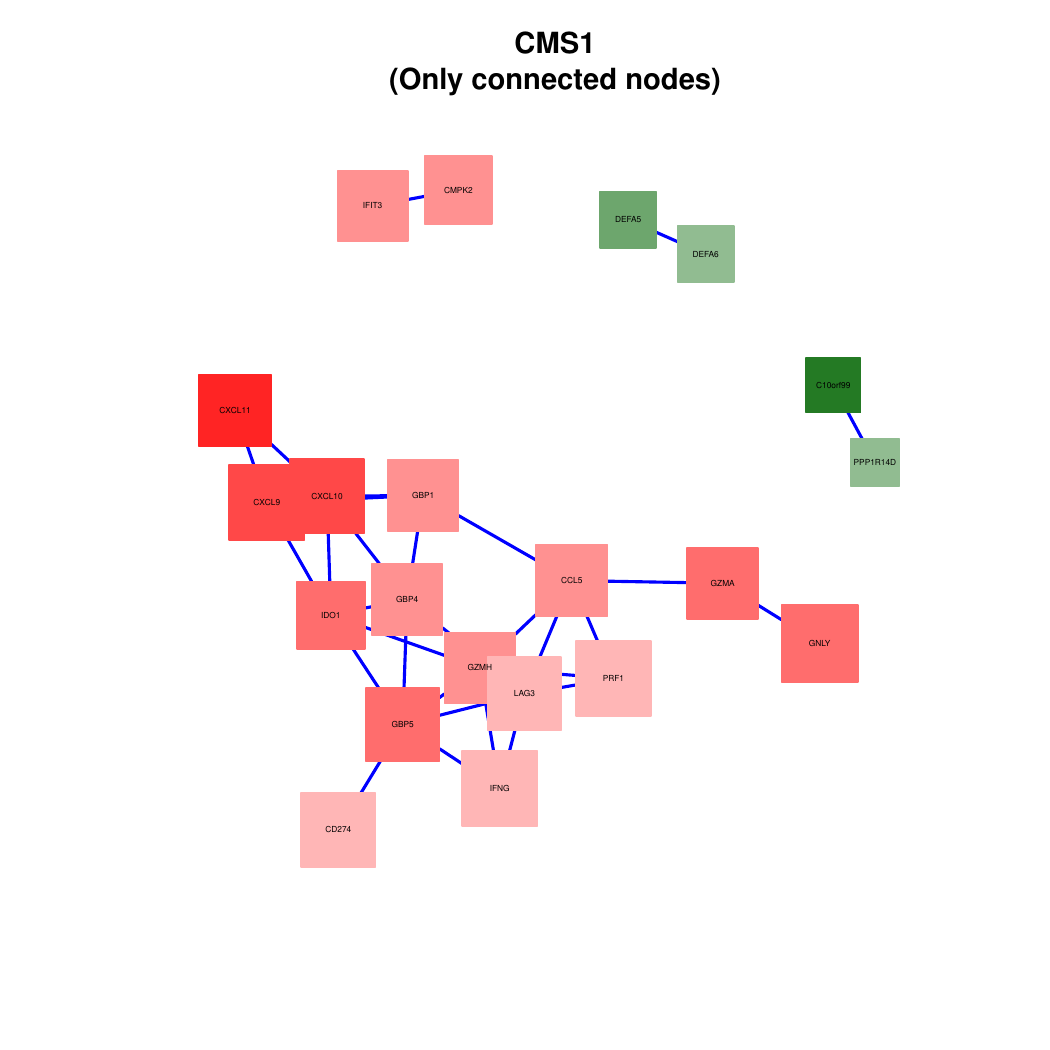
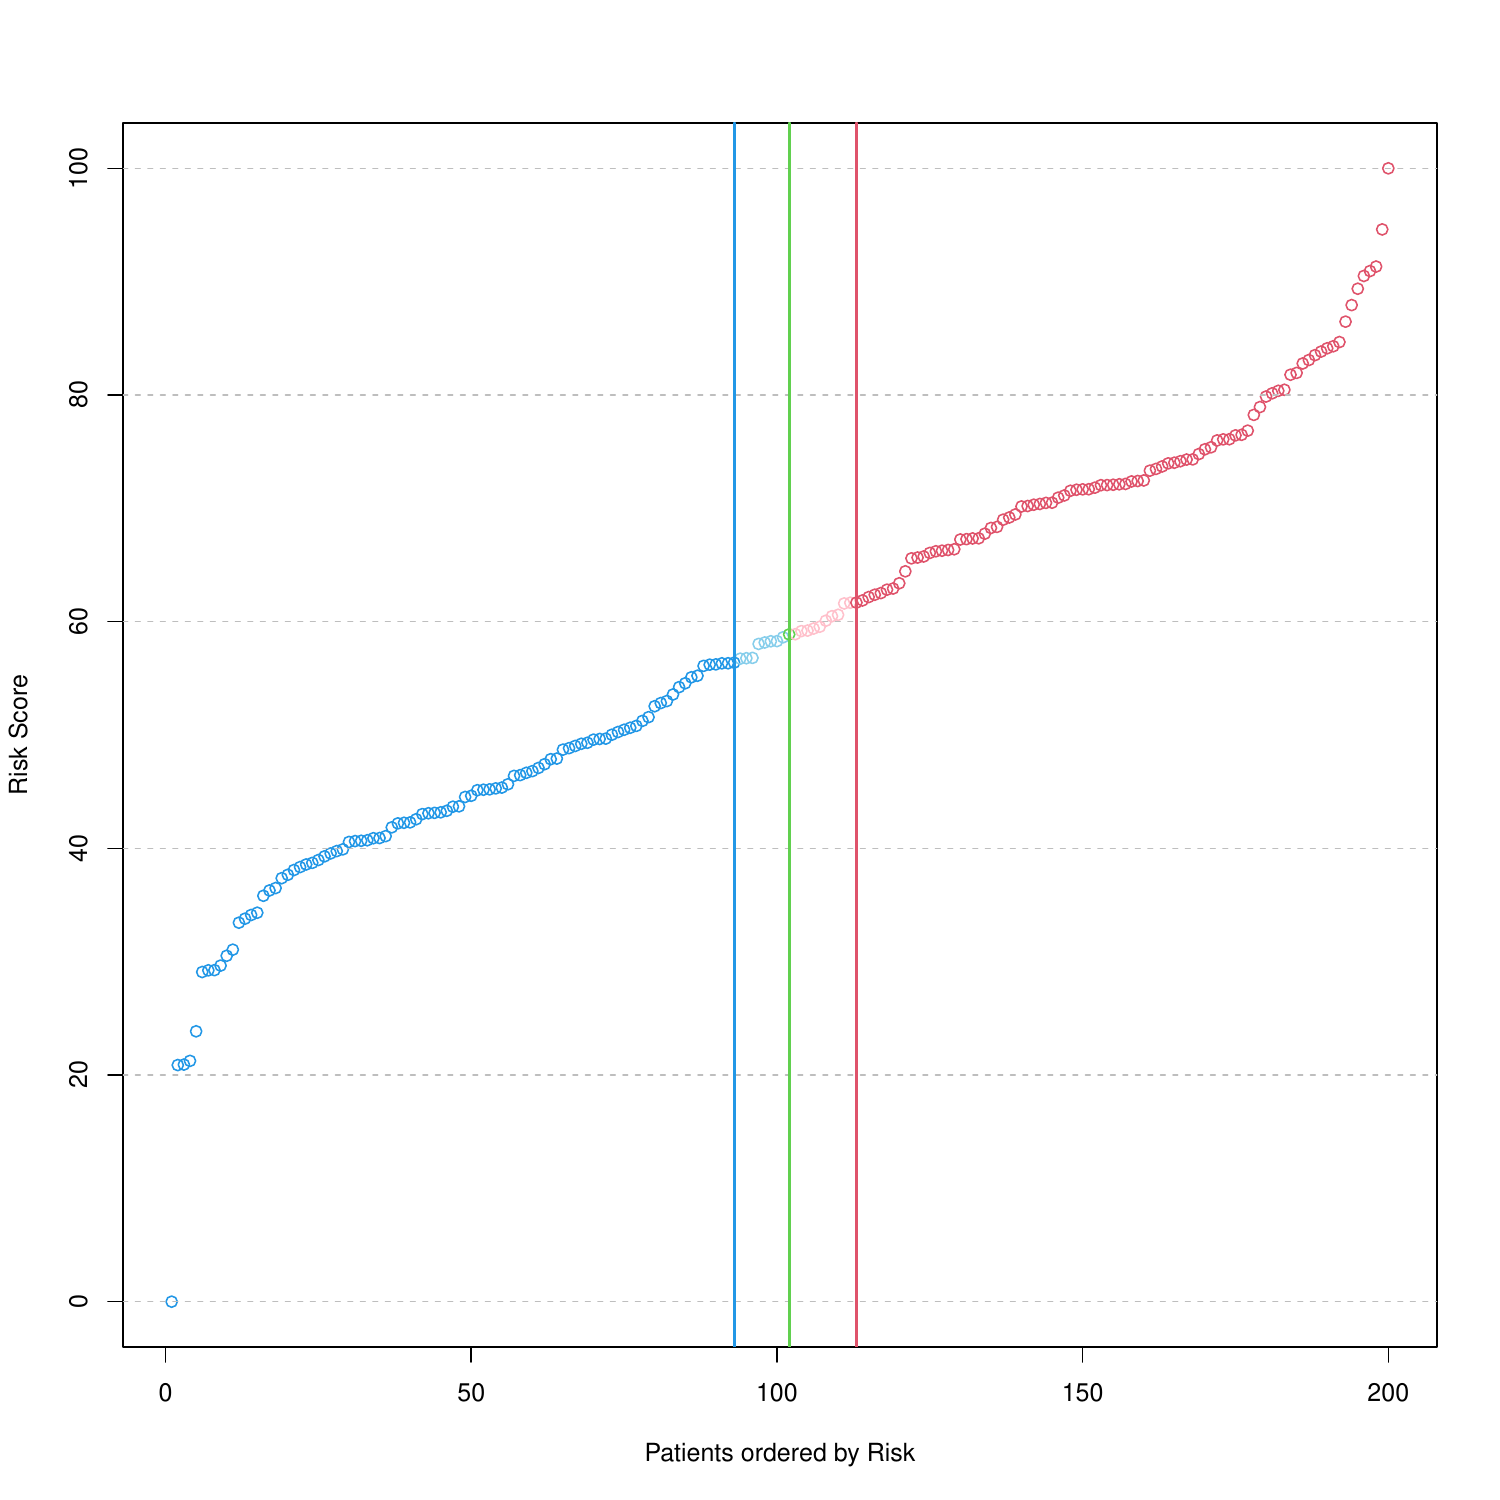
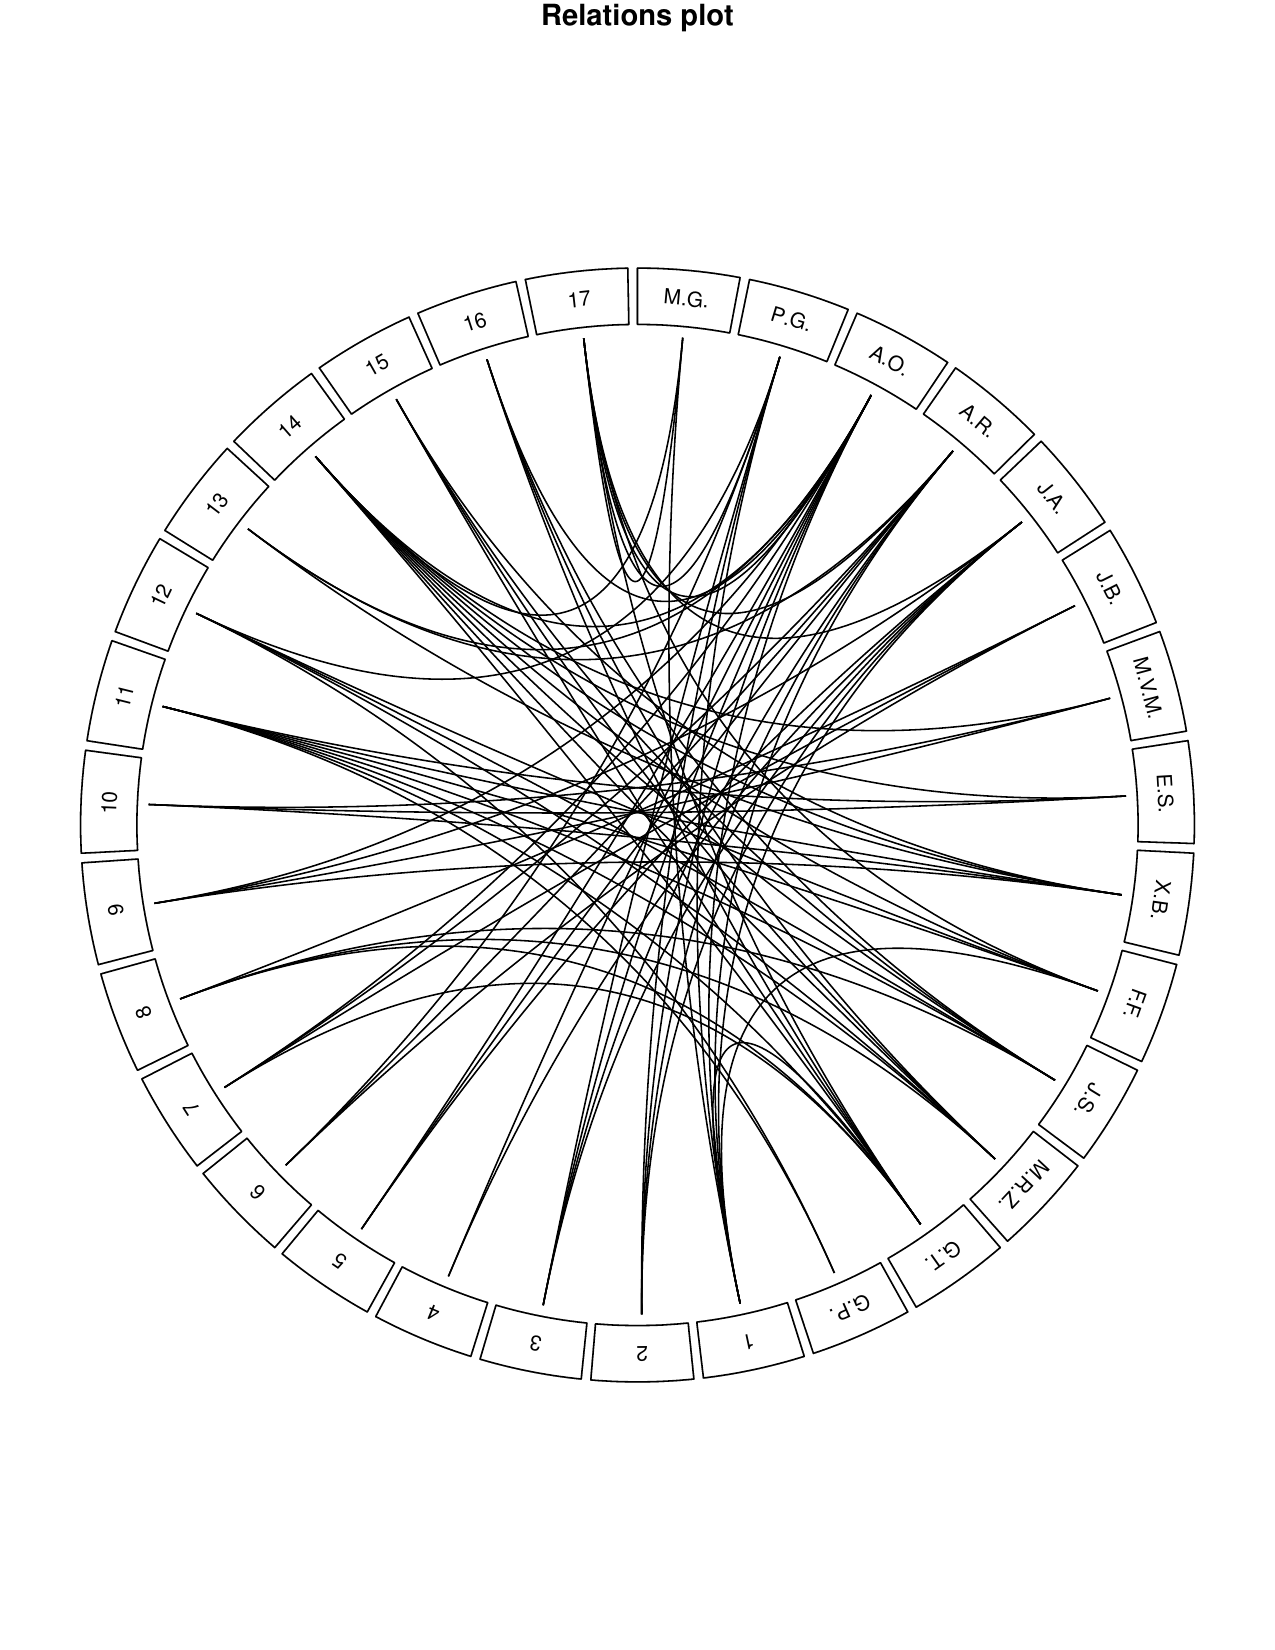
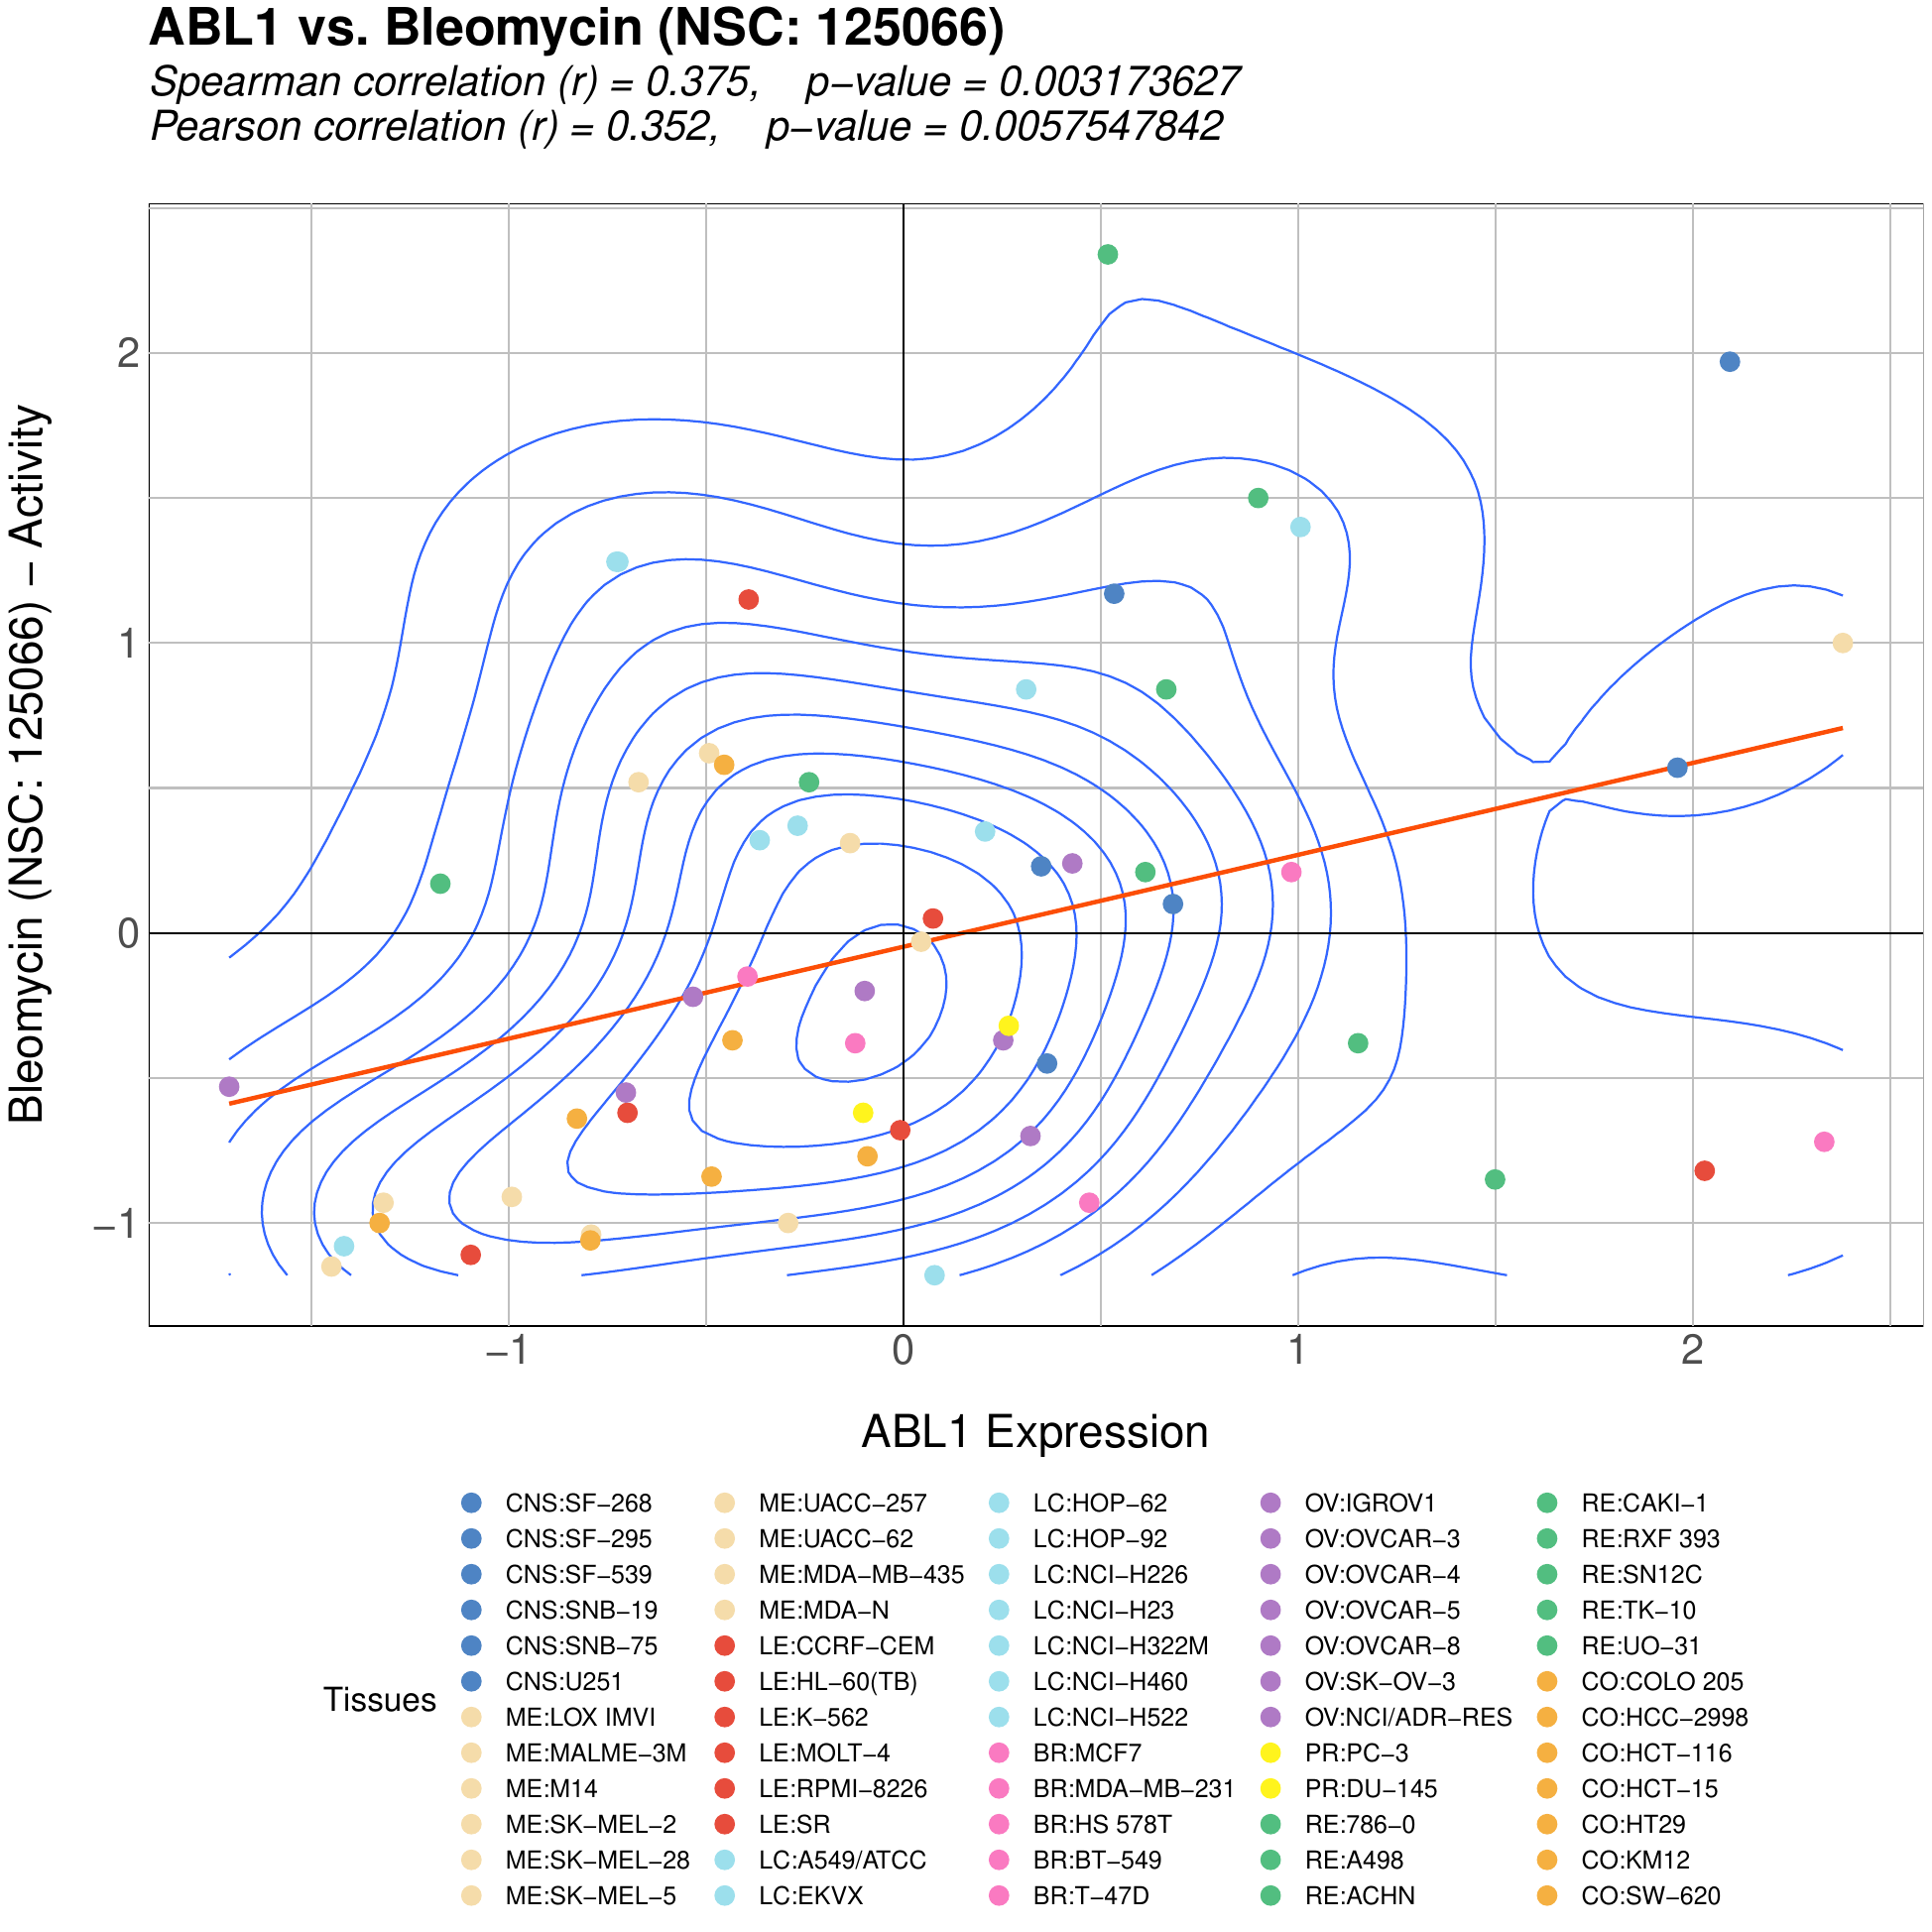
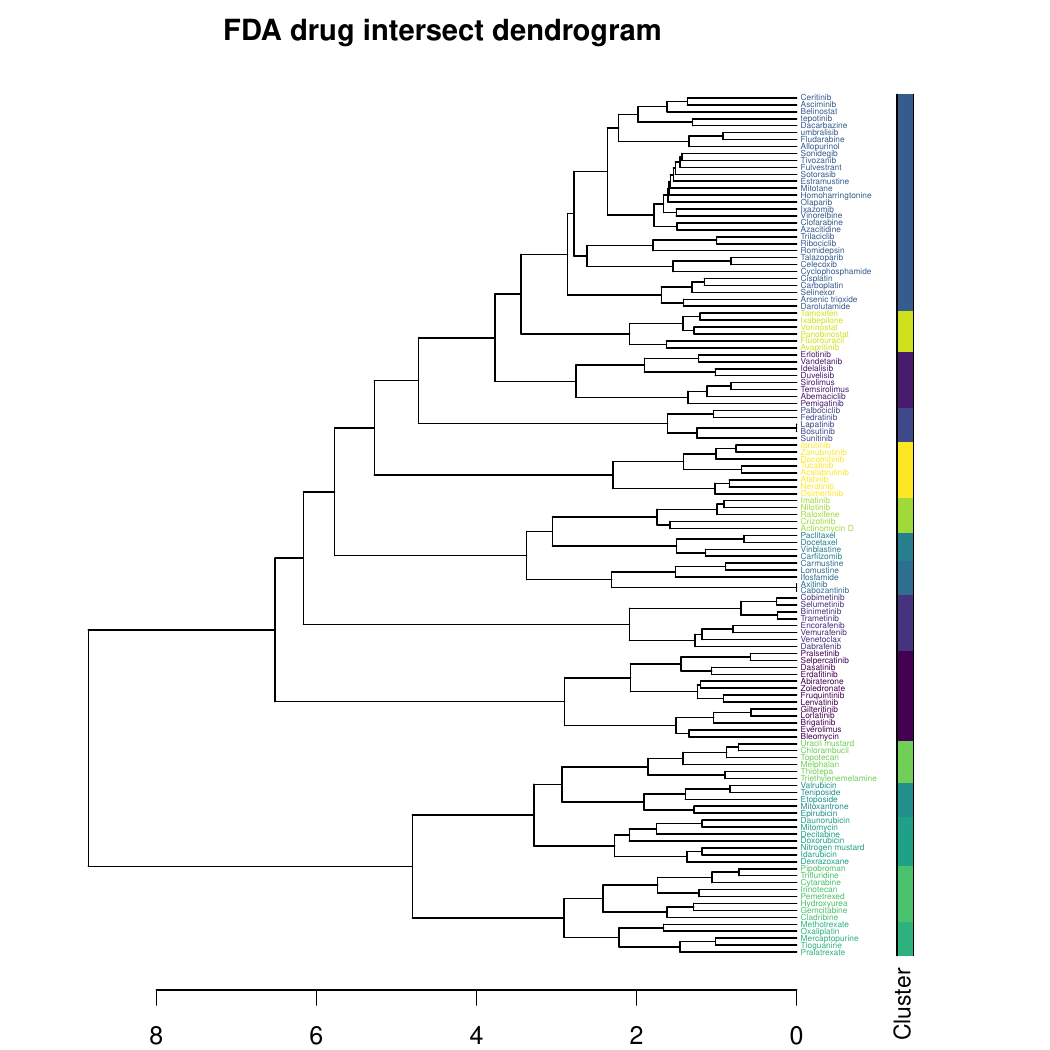
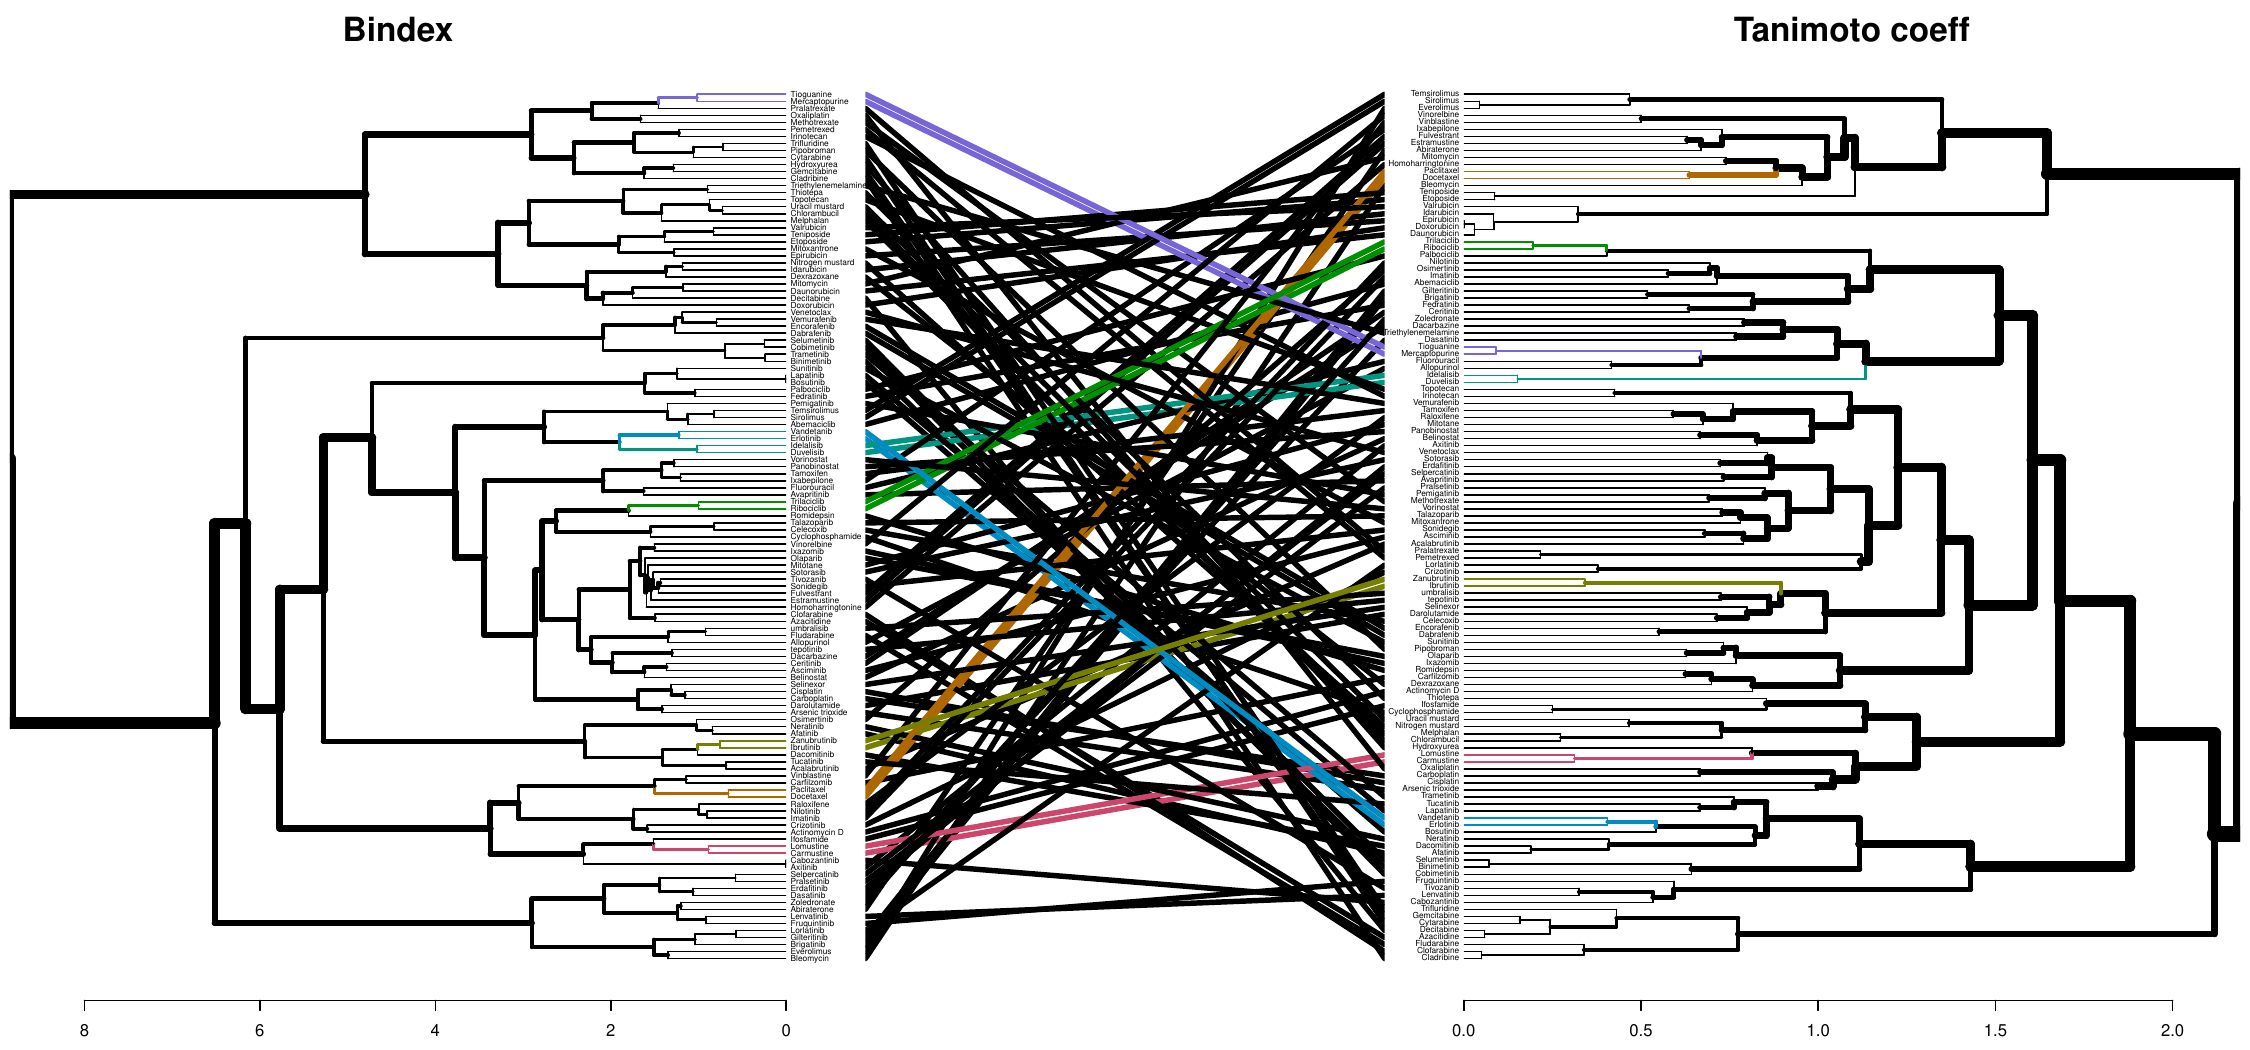
The images below show some of the results of my daily basis work. This process includes data exploration, pattern identification, network analysis or prediction, informed decision analysis and functional exploration of the results.

Chemical structure of Actinomycin-D.

Barplot of gene expression and drug activity for a pair of gene and drug (EGFR & Ibrutinib).

Beta values of Cox regression for survival analysis.

Chemical structuras of three drugs with max common substructure in blue.

Boxplot of CBLL1 expression across different colorectal cancer subtypes.

Signature expression of each cancer molecular subtype (CMS) for colorectal samples.

Correlation plot of different variables for dog knee surgery.

Expression density of normal vs tumor tissue expresion.

Distribution of similarity coefficients for drug databases.

General drug activity across NCI-60 cell line.

Differential expression for ESR1 gene to assign risk groups in survival analysis.

Go enrichment for protein interaction across a pathway.

Heatmap for different fibroblast conditions.

Correlation of gene-drug pairs across cell line tissues with no hierarchical clustering.

Inference of hen genes (blue labels) to human gen network (red).

Kaplan-Meier curves from survival analysis for high vs low risk patients.

Cluster of FDA drugs with high structural correlation.

Gene-drug interaction bipartite network.

Gene-gene interaction network with master regulators in red.

Optimal log-rank statistic p-value threshold estimation for splitting patients into high and low risk during survival analysis.

Selection of gene markers based on error rate for different iterations.

Total number of genes explored during each iteration for consesus molecular subtypes assignation.

CMS subtenwork of integrated genes.

Ordered risk patients with splitting threshold calculated based on log-rank p-value.

Circos plot of correlation between different assignation groups.

Scatterplot of gene expression and drug activity across multiple cell lines.

Drug clustering based on chemical structure.

Tanglegram to compare similar clusters using different structural similarity coefficients.

Circosplot on expression across different groups with variables differences.